30 Features Histogram
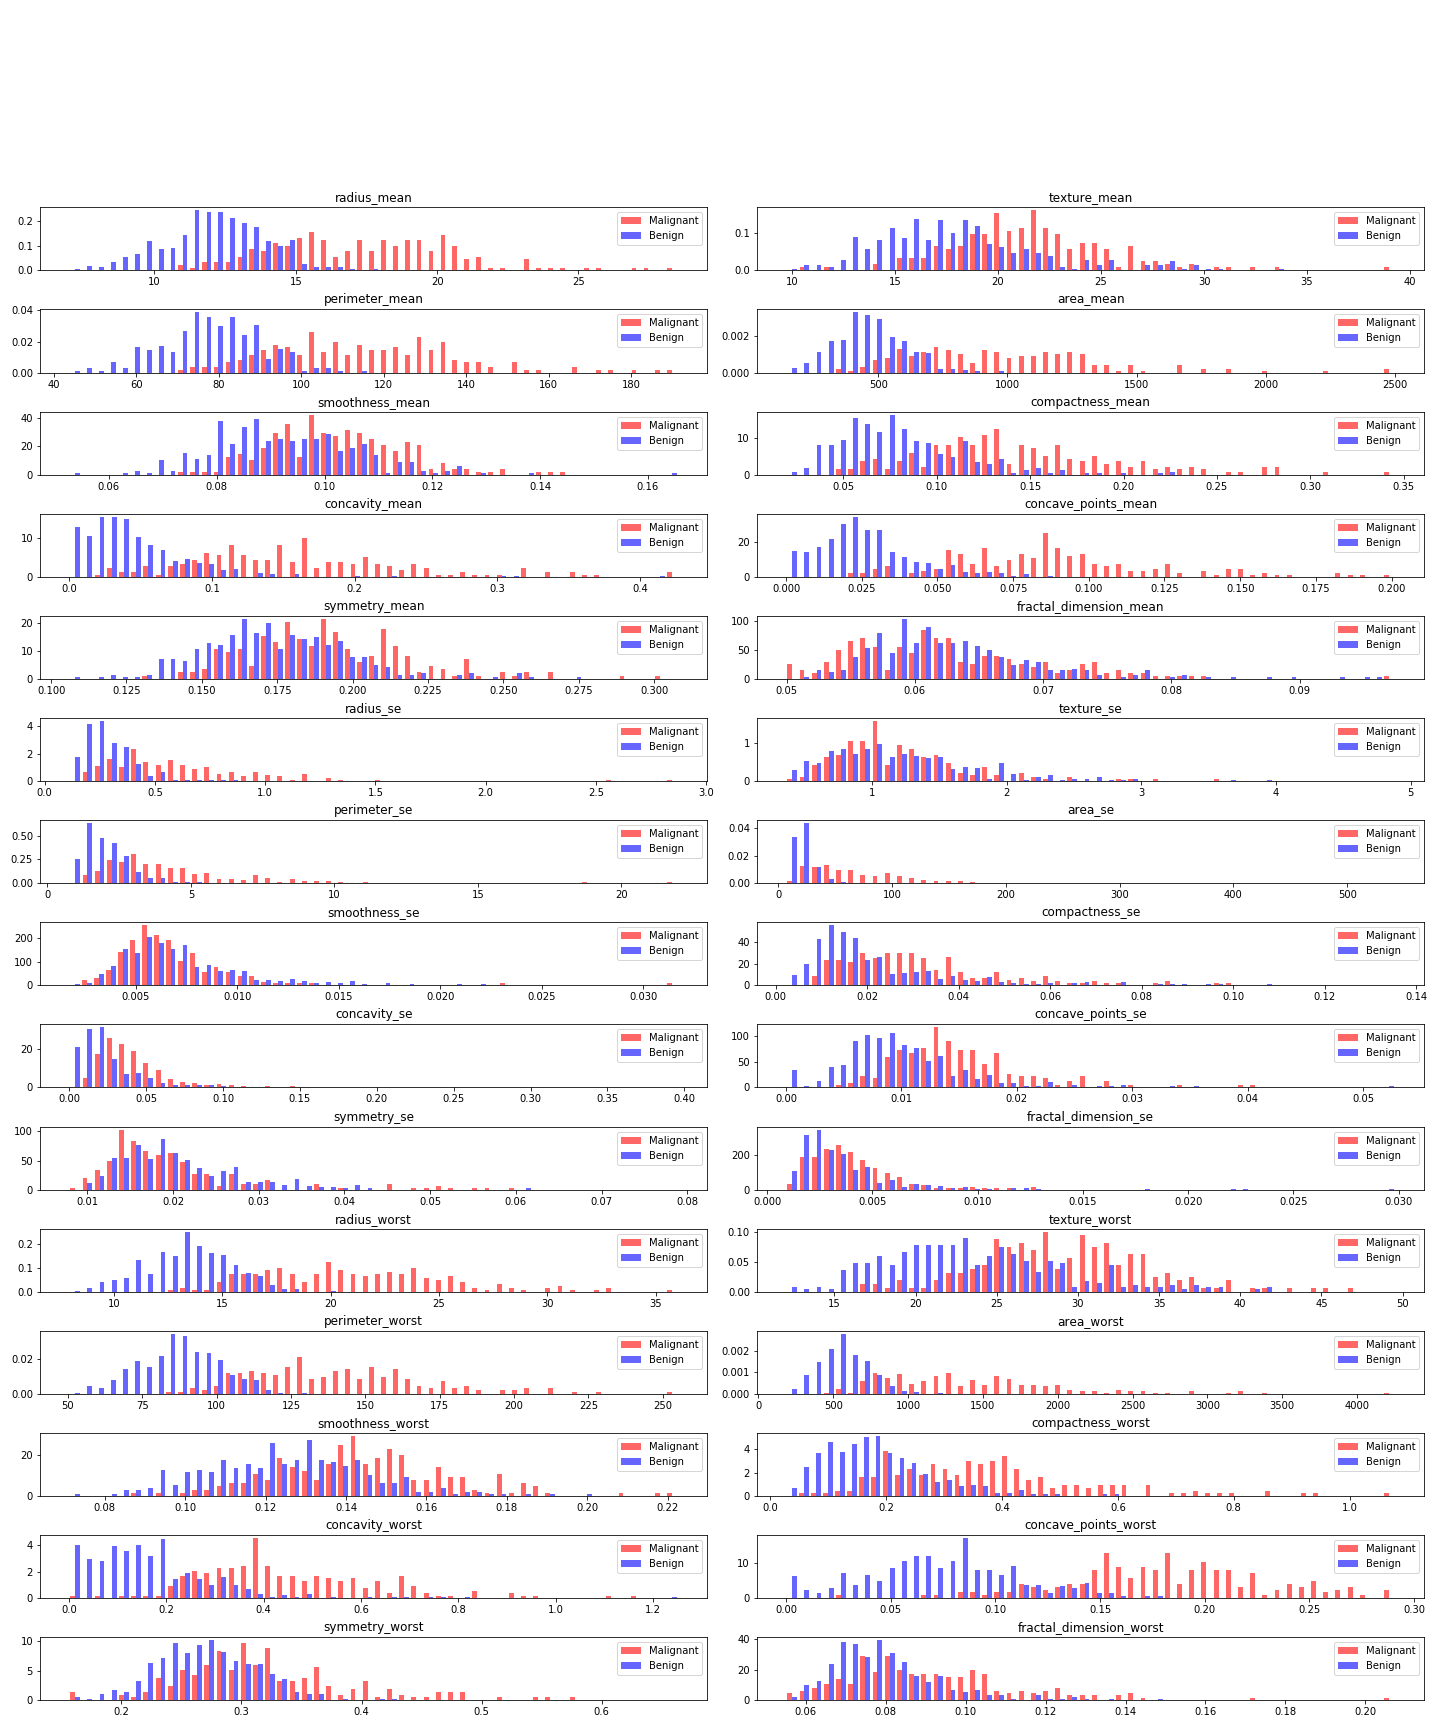
From observing the graph data above: fractal_dimension_mean, smoothness_mean, symmetry_mean, texture_mean, texture_worst, smoothness_worst, compactness_worst, 'symmetry_worst', 'fractal_dimension_worst' and all of the SE features are not very useful in predicting the type of cancer. These columns will be dropped.
10 Features Histogram
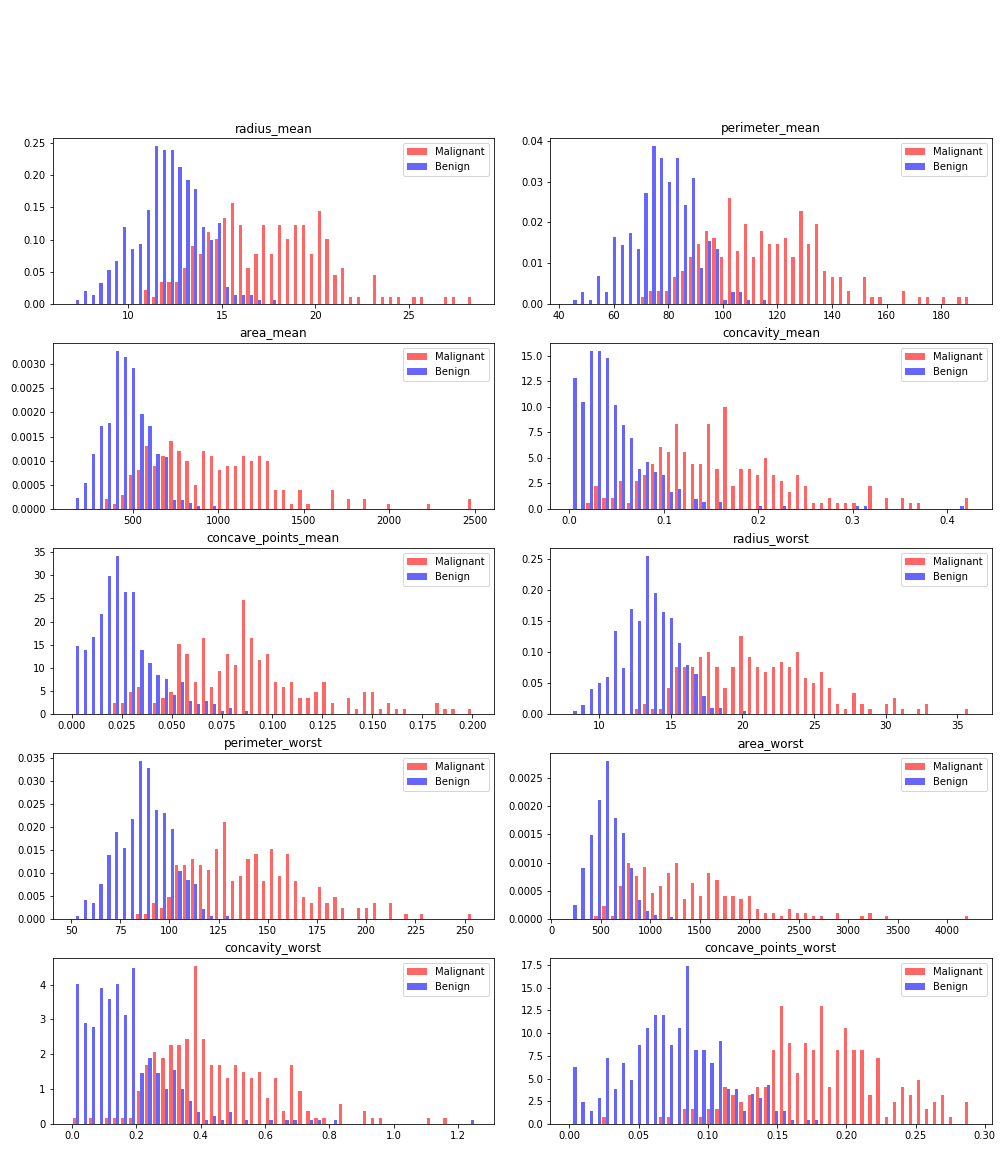
From the graphs, we can see that radius_mean, perimeter_mean, area_mean, concavity_mean and concave_points_mean are useful in predicting cancer type due to the distinct grouping between malignant and benign cancer types in these features.
We can also see that radius worst, area_worst, perimeter_worst,'concavity_worst', 'concave_points_worst' are also quite useful.
