Breast Cancer Wisconsin (Diagnostic) Dataset
Tha dataset I used in this projest comes from UC Irvine Machine Learning Repository
- Features Information:
Data Set Information:
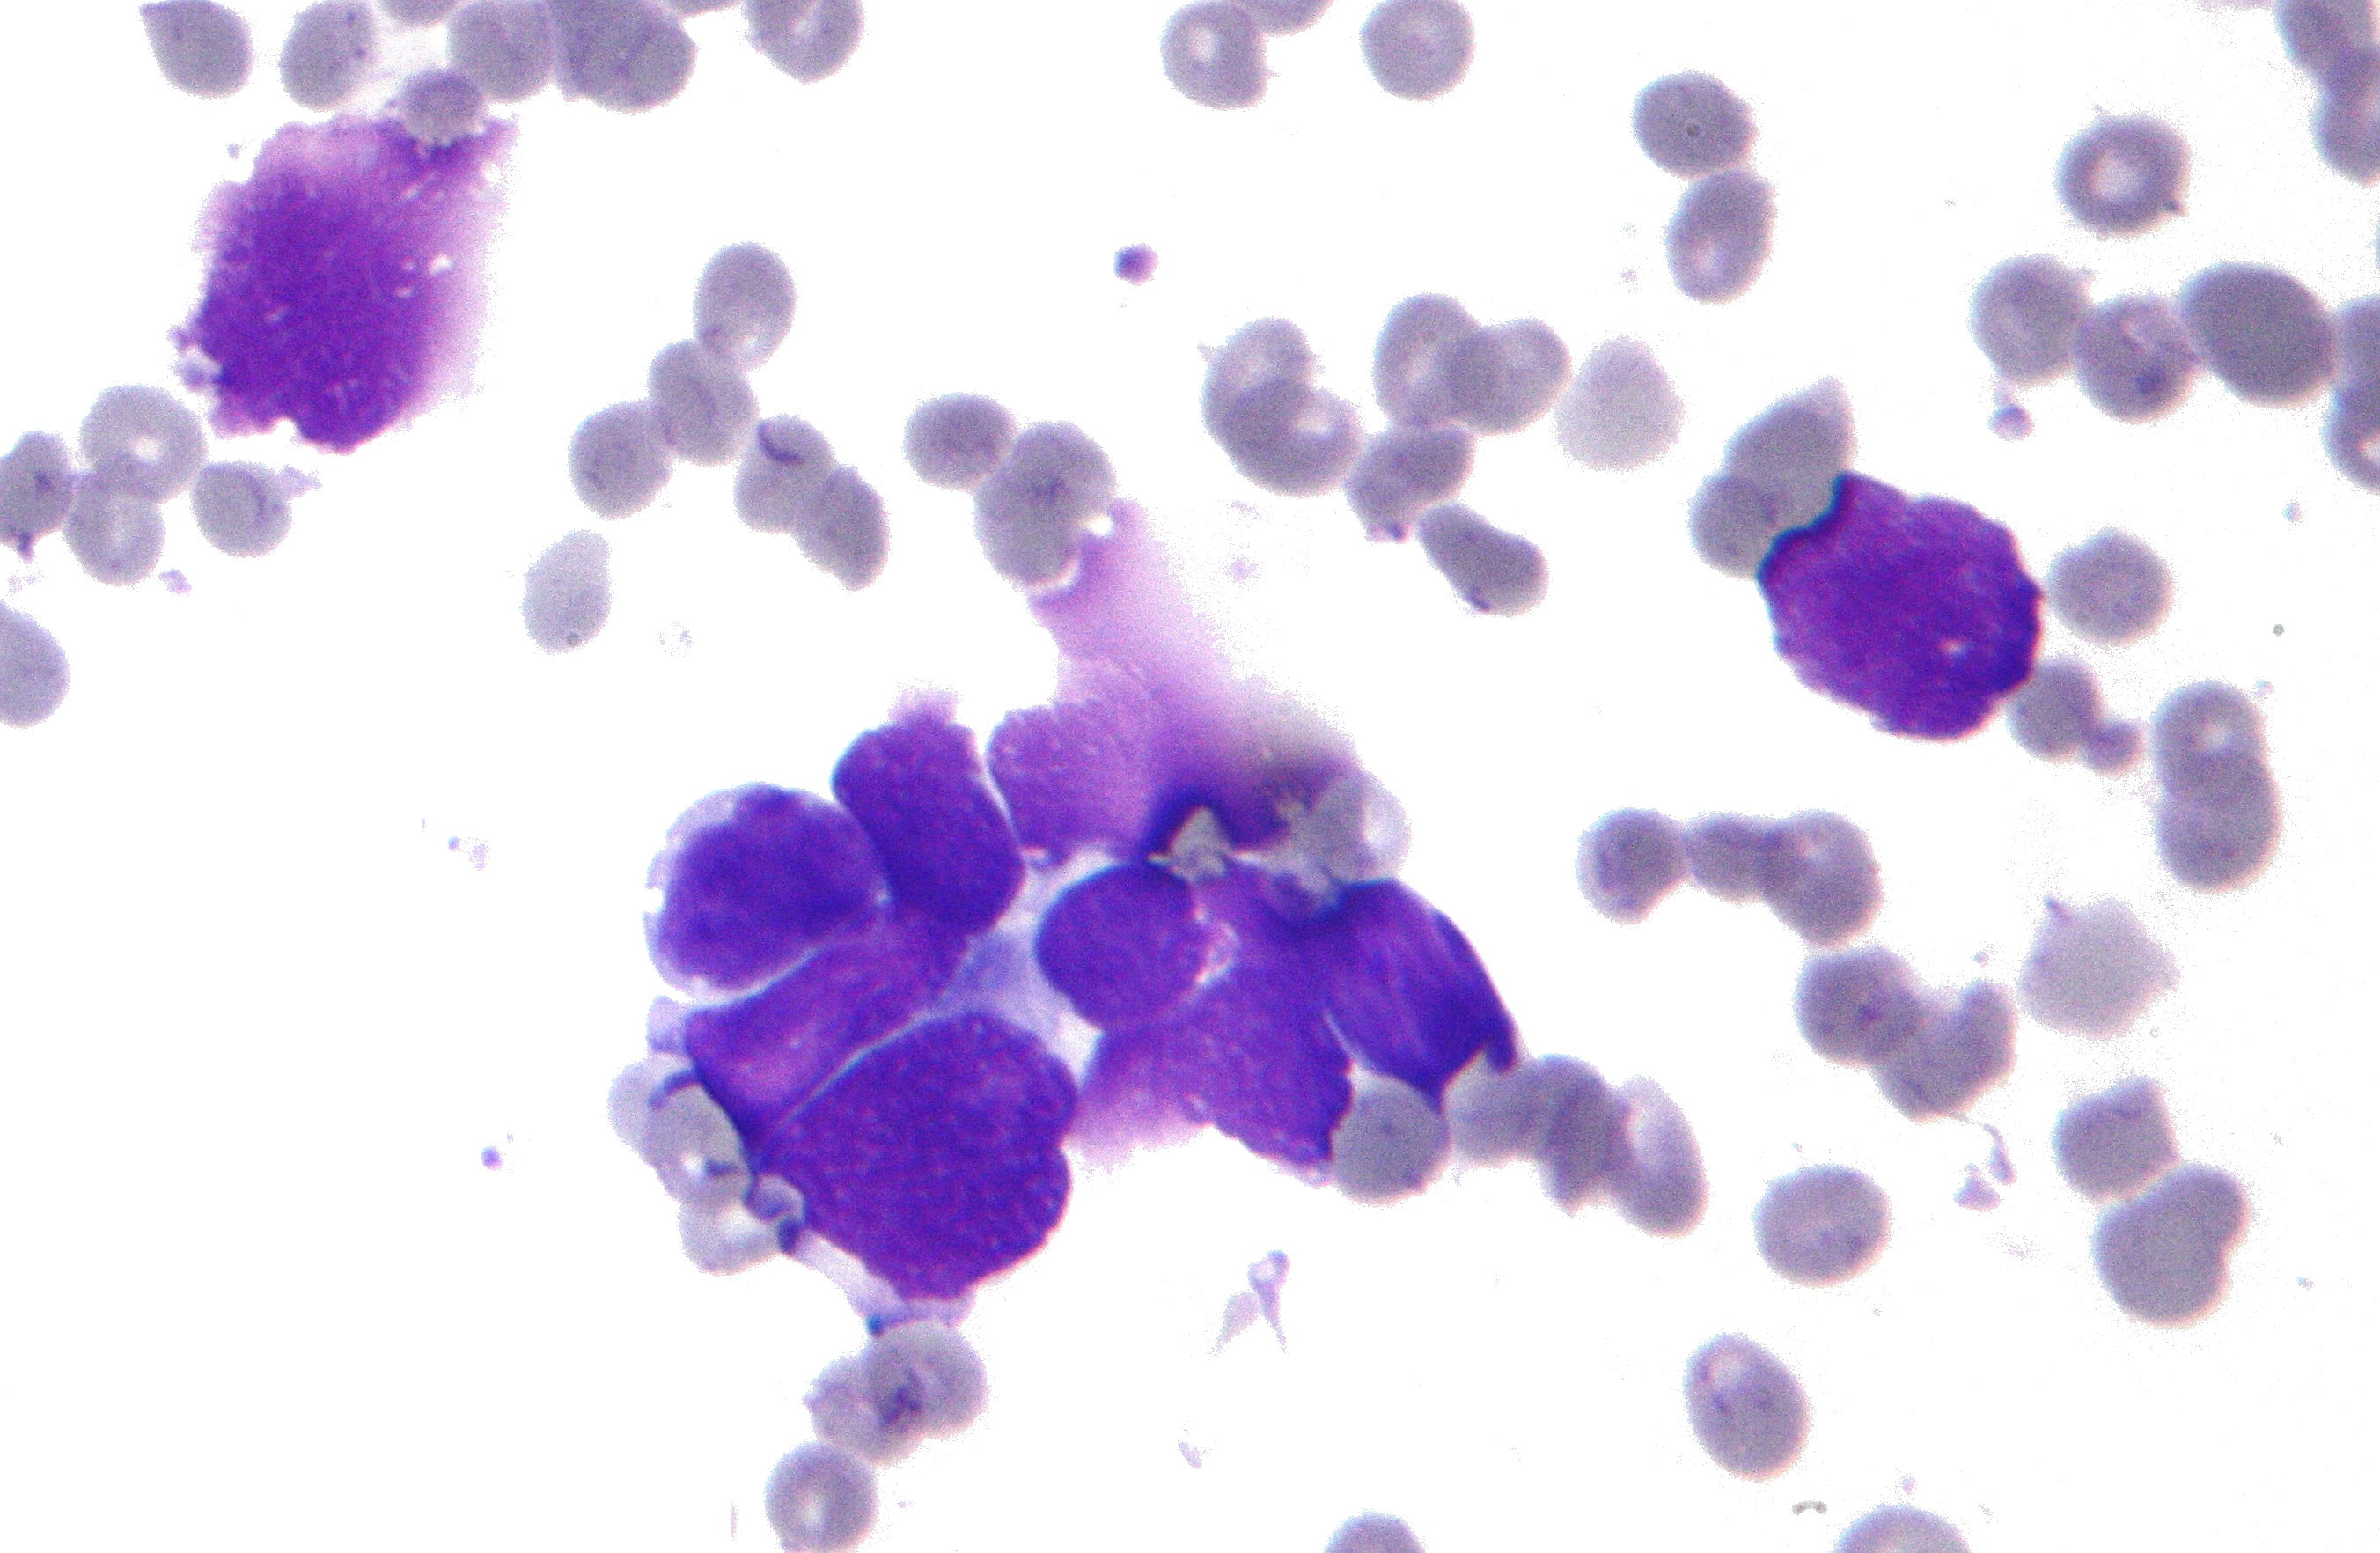
Features are computed from a digitized image of a fine needle aspirate (FNA) of a breast mass.They describe characteristics of the cell nuclei present in the image. Nuclear parameters were calculated using the Image software
The computer calculated the mean value, the “largest” value, and the SE for each nuclear feature, resulting in a total of 30 features. The largest value for each feature was the mean of the three largest values for all nuclei in the analyzed image.
Attribute Information
Patient ID number
Diagnosis (M = malignant, B = benign)
Radius was computed by averaging the length of radial line segments from the center of the nuclear mass to each of the points of the nuclear border.
Perimeter was measured as the distance around the nuclear border.
Area was measured by counting the number of pixels in the interior of the nuclear border and adding one-half of the pixels on the perimeter.
Perimeter and area were combined to give a measure of the compactness of the cell nuclei using the following formula: perimeter2/area.
Smoothness was quantified by measuring the difference between the length of each radius and the mean length of adjacent radii.
Concavity was determined by measuring the size of any indentations in the nuclear border.
Concave points counted the number of points on the nuclear border that lie on an indentation.
Symmetry was measured by finding the relative difference in length between line segments perpendicular to and on either side of the major axis.
Fractal dimension was approximated using the “coastline approximation” described by Mandelbrot that measured nuclear border irregularity.
Texture was measured by finding the variance of the gray scale intensities in the component pixels.