Shuzhen Yu, MBBS MS

Data Analyst

Data Analytics Boot Camp at The George Washington University

About Me

Professional research scientist and data analyst with 15 years’ academic experience including 10 years of experience of clinical and research data management and analytics. I earned my Data Analytics Boot Camp Certificate from The George Washington University to enhance my technology skills by learning new analytical languages and libraries.

Proficiency in a broad array of technologies like Advanced Excel, VBA, Python Programming (libraries Pandas, NumPy, Matplotlib, Beautiful Soup, Plotly and Scikit-learn), Databases(MySQL, MongoDB, SQLAlchemy) , Python API, Front–End Web Visualization( HTML, CSS, Javascript, D3 and Leaflet), Tableau, R , Big Data, NLP and Machine Learning.

Currently I am looking for data analyst opportunities in healthcare or other industries.
Projects

Below are some of the projects I've completed. Please check my Github account for more projects.

Please click on the "image" or "repo sign" to view the site.

breast cancer

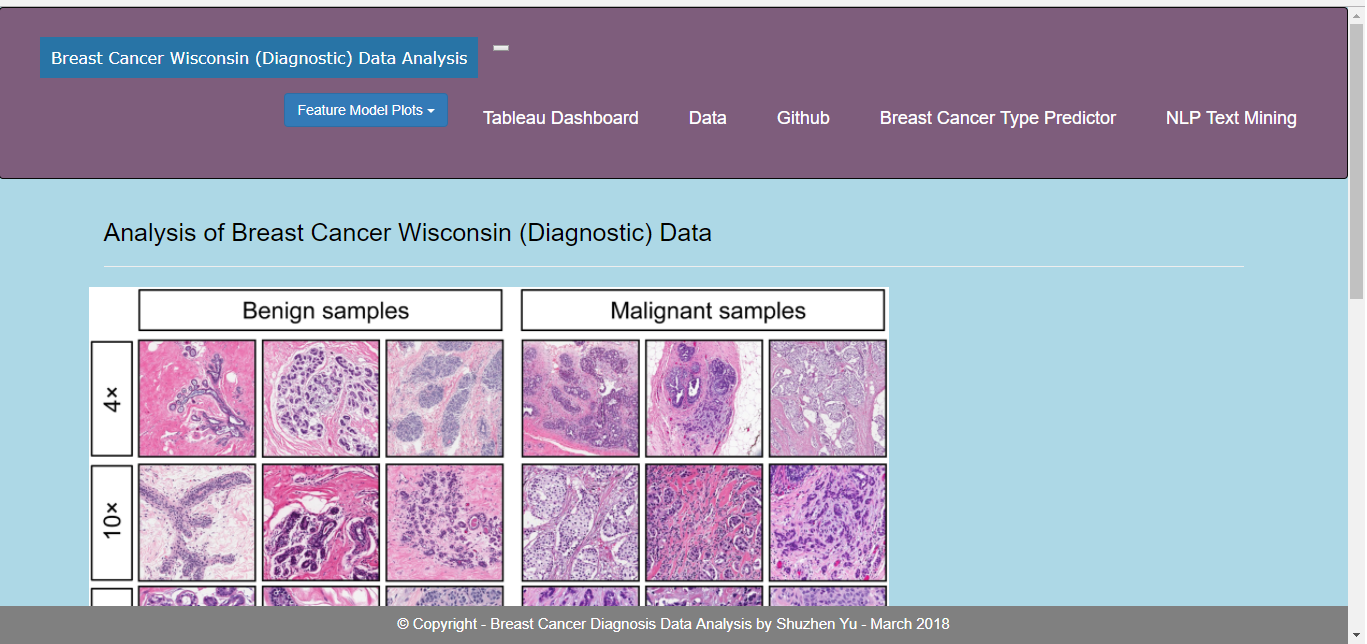
Breast Cancer Diagnosis Data Analysis with Machine Learning and NLP

Data was collected from UC Irvine Machine Learning Repository. Used Machine Learning to create Flask API to predict the breast cancer type by putting the new patient parameter data.

Data and results were displayed in datatable page and Plots. NLP Text Mining and Tableau also were used to analysis and visualize the data.

Deployed the FLASK APP to Heroku.

Breast Cancer Diagnosis Data Analysis Repo Machine Learning Model predictor in Heroku Data Visualization
airbnb

Airbnb Linstings Analysis in DC

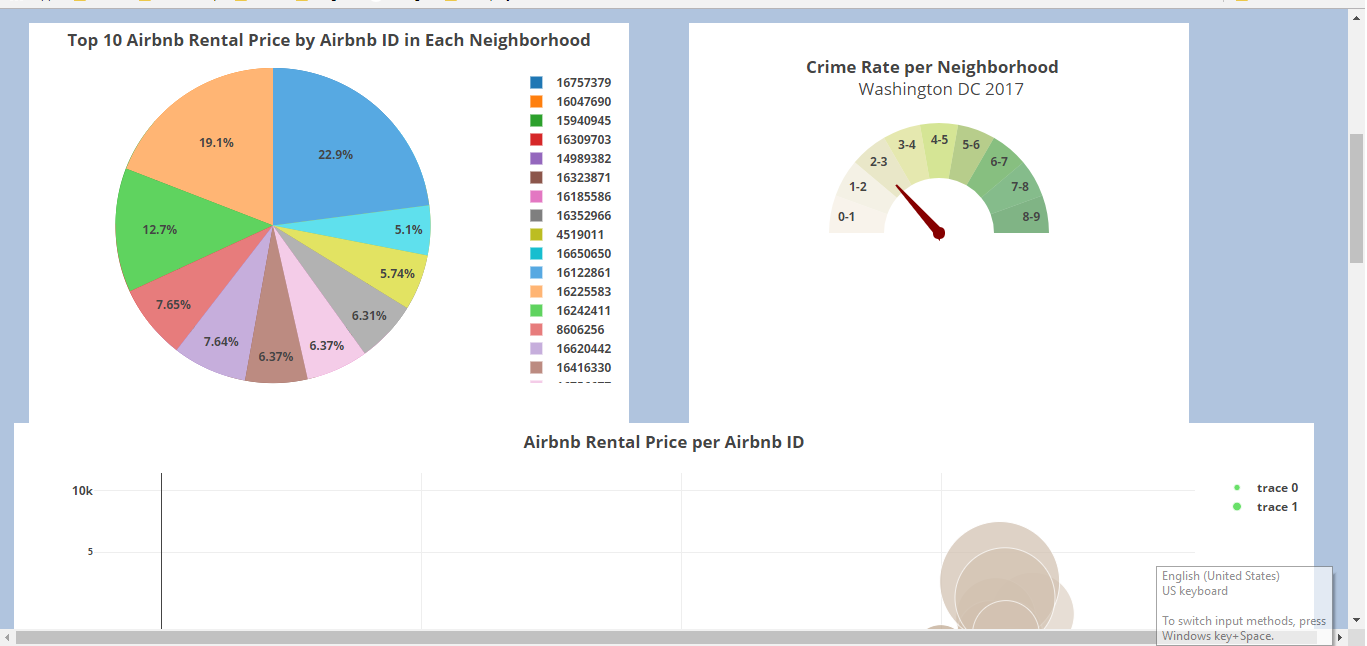
This project analyzed data of Airbnb listings in Washington DC. Created a dashboard to show distribution of listing price, review, availability and crime in different neighborhoods and estimate their relationship.

Collected and cleaned up CSV data, Created a SQLite Database and FLASK API, Used HTML,CSS,Javascript and Plotly to create a dashbaord

Deployed the FLASK APP to Heroku.

Airbnb Listings Data Analysis in Washington DC Repo Data Visualization in Heroku
latitude

Web Visualization Dashboard (Weather_Latitude)

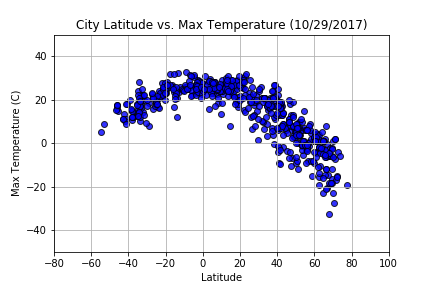
Used Bootstrap, HTML, CSS to create visualization dashboard website using visualizations tools and the API data.

In building this dashboard, I created individual pages for each plot and a means by which user can navigate between them. These pages will contain the visualizations and their corresponding explanations. I also created a landing page, a page where user can see a comparison of all of the plots, and another page where user can view the data used to build them.

All of the websites work at all window widths/sizes and the main website was deployed to github pages.

Weather_Latitude App Repo Weather_APP_Visualization
citibike

Visualizing Citi Bike Data with Tableau

Used Tableau to create Dashboard based upon the citi_bike 2018 Data.

Citi Bike Data Repo Data Visualization
ufo

Belly-Button-Biodiversity-JavaScript-APIs-and-SQLAlchemy

Builded an interactive dashboard to explore the Belly Button Biodiversity DataSet using Bootstrap, JavaScript and Plotly.

Created Flask API to serve the HTML and JavaScript required for dashboard page and Plotly.js to build interactive charts for dashboard.

Belly-Button-Biodiversity Repo Data Visualization in Heroku
mars

Mission to Mars

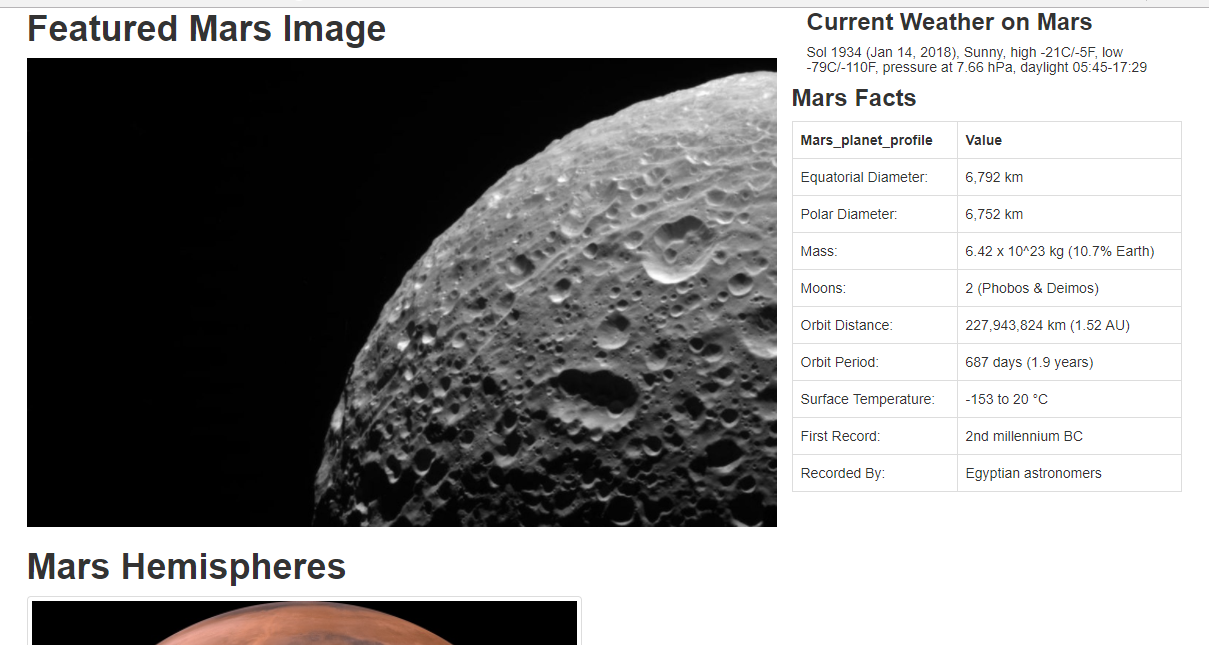
Builded a web application that scrapes various websites for data related to the Mission to Mars and displays the information in a single HTML page.

Scraped the Mars related websites using Jupyter Notebook, BeautifulSoup, Pandas, and Requests/Splinter.

Used MongoDB with Flask templating to create a new HTML page that displays all of the information that was scraped from the URLs above.Use Pymongo for CRUD applications for database

Builded a web application that scrapes various websites for data related to the Mission to Mars and displays the information in a single HTML page.Use Bootstrap to structure HTML template

Mission to Mars Repo
Hawaii

Surfs Up!

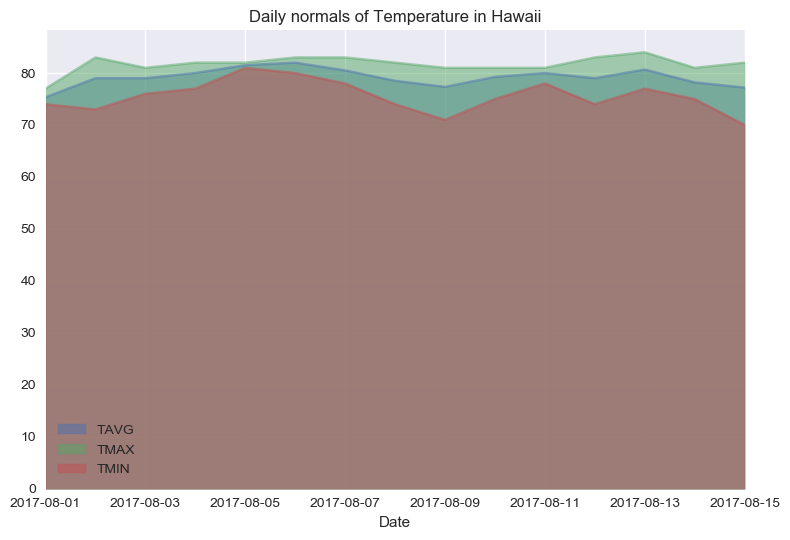
Provided a climate analysis API to help with user's trip planning in Honolulu, Hawaii

The climate data for Hawaii is provided through two CSV files. Start by using Python and Pandas to inspect the content of these files and clean the data.

Used SQLAlchemy to model the table schemas and create a sqlite database for the tables.

Used Python and SQLAlchemy to do basic climate analysis and data exploration on the new weather station tables. All of the following analysis will be completed using SQLAlchemy ORM queries, Pandas, and Matplotlib.

Designed a Flask APP based on the queries that I have just developed.

Surfs Up! Repo
Tweets

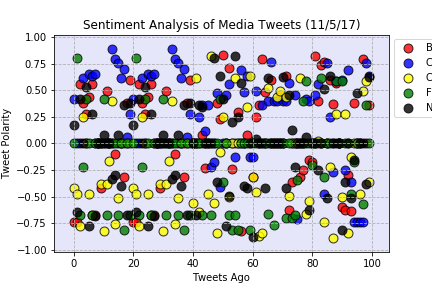
Distinguishing Sentiments--News Mood

Used Twitter API, Jupyter Notebook, Matplotlib and Seaborn libraries to create Python script to perform a sentiment analysis of the Twitter activity of various news oulets, and to present the findings visually.

Distinguishing Sentiments Repo
tumor

Pymaceuticals Inc

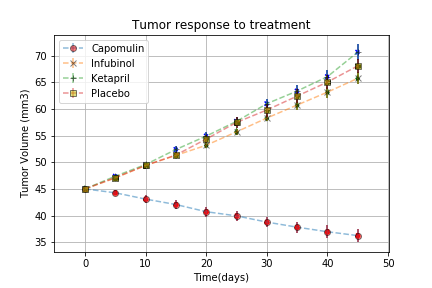
Analyzed the data to show how four treatments (Capomulin, Infubinol, Ketapril, and Placebo) compare to help the screening for potential treatments to squamous cell carcinoma (SCC)

Used the Pandas Library, the Jupyter Notebook, the Matplotlib and Seaborn libraries to create scatter plots and bar graph that compares the tumor volume, Metastasis sites change for each drug across the treatment.

Pymaceuticals Inc Repo

Skills

  • Advanced Excel, VBA
  • Python(Pandas, Matplotlib, Beautiful Soup, Plotly and Scikit-learn)
  • Python API, Social Media API
  • MySQL, SQLAlchemy, MongoDB, Flask API
  • HTML, CSS, Bootstrap
  • Javascript, D3.js, Plotly.js
  • Leaflet.js, CartoDB
  • Tableau
  • Hadoop,Big data, Machine learning, Deep learning
  • R

Experience

University of Maryland School of Medicine, Department of Neurology
Baltimore VA Medical Center, Geriatric Research, Education and Clinical CenterResearch Supervisor

December 2003-July 2017

* Manages and conducts research projects in stroke and diabetes and assists patients’ muscle biopsy and blood samples collection.

* Creates and maintains patients ’clinical samples and research data database. Develop and improve novel gene and protein expression techniques applied in stroke and diabetic neuropathy research.

* Compiles, analyzes, and interprets clinic and research data using various computer and statistical software applications such as advanced Excel and SPSS.

* Performs data visualization to prepare manuscripts, scientific illustrations and graphics for publications. Contributes to the preparation of journal articles and grant proposals.

* Develops standards of performance(SOP) and provides technical oversight of labs, equipment and testing. Serves as a resource for problem solving and process improvement.

* Trains PH.D., Medical students, undergraduate and visiting scholars on laboratory techniques and experiments.

Education

George Washington UniversitySeptember 2017 – March 2018

GW Data Analytics Boot Camp

Nanjing Medical UniversitySeptember,1997-June 2000

Master of Science in Pathology and Pathophysiology, Atherosclerosis Research Center

Taishan Medical UniversitySeptember 1990-July 1995

Bachelor of Clinical Medicine, Department of Clinical Medicine

Contact Me

Email: shuzhenyu1087@gmail.com

Copyright 2018 | Shuzhen Yu